CD_Fit5
A Method using
Match and Linear Regression to Estimate Protein
Secondary
Structure from Circular Dichroism Spectra
CD_fit5
is an algorithm to estimate the secondary structure of a protein
from its circular dichroism (CD) spectrum. This is accomplished
by first matching the given spectrum to the existent spectral
dataset of known proteins, using the normalized root
mean square deviations (NRMSD) as a goodness-of -fit paramenter.
The residual spectrum is then fit by the other 4 standard spectra
using linear regression. The CD measurement
is carried out by synchron radiation with measurement range
in vacuum ultraviolet (175 nm to 260 nm), which could cover
most of the experimental data. The program
provides a friendly interface for user to understand and operate and
the dataset can be easily modified even for non-expert users.
CD_Fit5 can also evaluate the
effects of mutations, ligands and solvents on the protein secondary
structure conformation.
Go to Web
Server of CD_Fit5 (Web
browser shall support HTML5) Detail
discription
CD_Fit5
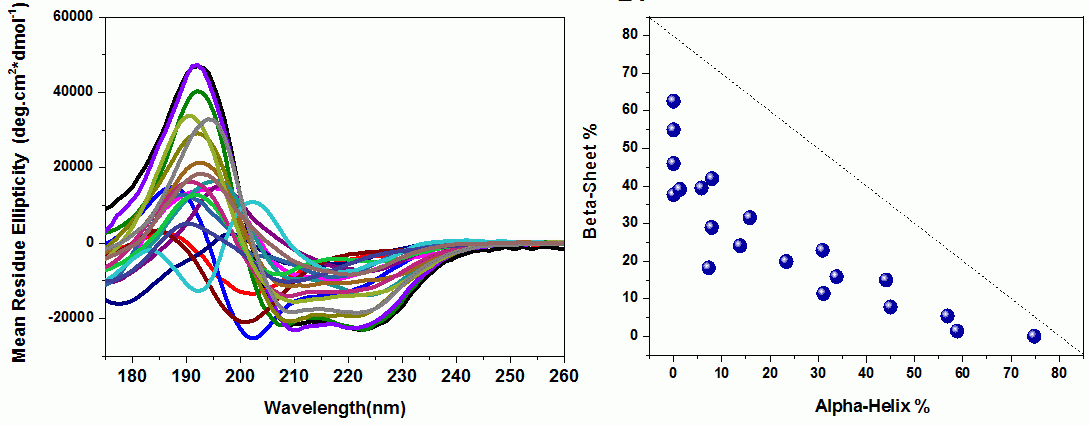
program used 20 intrinsic CD spectra for the initial matching, the
protein dataset of 20 proteins included : Myoglobin (Myo),
Rice
amylase subtilisin
inhibitor (RASI), Aprotinin (APRT), Beta lactoglobulin (BLAC),
Calmodulin (CAL),
Carbonic anhydrase II (CA2), Citrate synthase
(CITS), Concanavalin A(CONA), Ferredoxin (FERD), Glycogen
phosphorylase-b (GPB), Beta-crystallin S (B-Crysl), Nitrogen metabolite
repression
regulator (NMRA),
Phenylethanolamine N-methyltransferase (PNMT) Ubiquitin(UBIQ), Beta
amylase (BAMY), Jacalin (JAC), Superoxide dismutase
(SOD), Alpha Amylase (AAMY), Reaction centre protein
(RCP), Sucrose porin (Porin).
After
finding the best matching for the spectrum in query, the residual
was acquired by subtracting a proportion of the best match. ( the
proportion factor can be adjusted in the interface) from the query
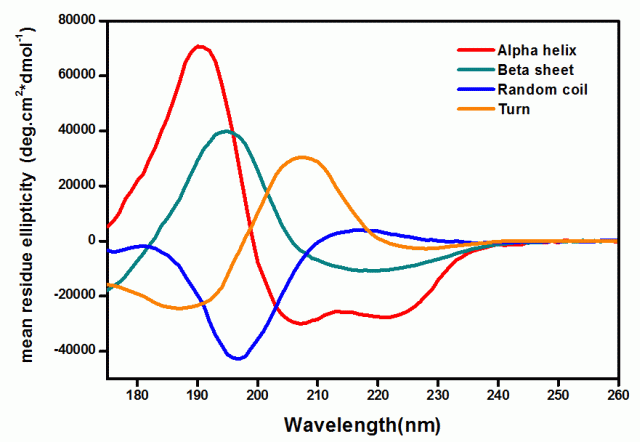
spectrum. The residual spectrum is then fitted by 4 CD spectra of
individual standard secondary structures using linear regression. The
secondary structure ratio for the query spectrum was a weighted linear
combination of the ratio from the matching protein and 4
standard structures.
Figure Left:
The CD dataset of 20 proteins for matching. Right:
Secondary structure space coverage (percentage of helix versus percentage
of sheet) of the 20 proteins for matching.
Figure:
The CD dataset of 4 standard 2nd structural peptides: Helix 100%
(Poly-L-glutamic, pH: 4, ddH2O) [Rad],
Sheet 100% [Dark Cyan], Random Coil 100% (Poly-L-glutamic, pH: 7,
ddH2O) [Blue], Turn 100% (simulated) [Orange].